Highs, Lows, and Other Notes from Mariners’ Three Losses to Royals

[caption id="" align="alignnone" width="3028"]

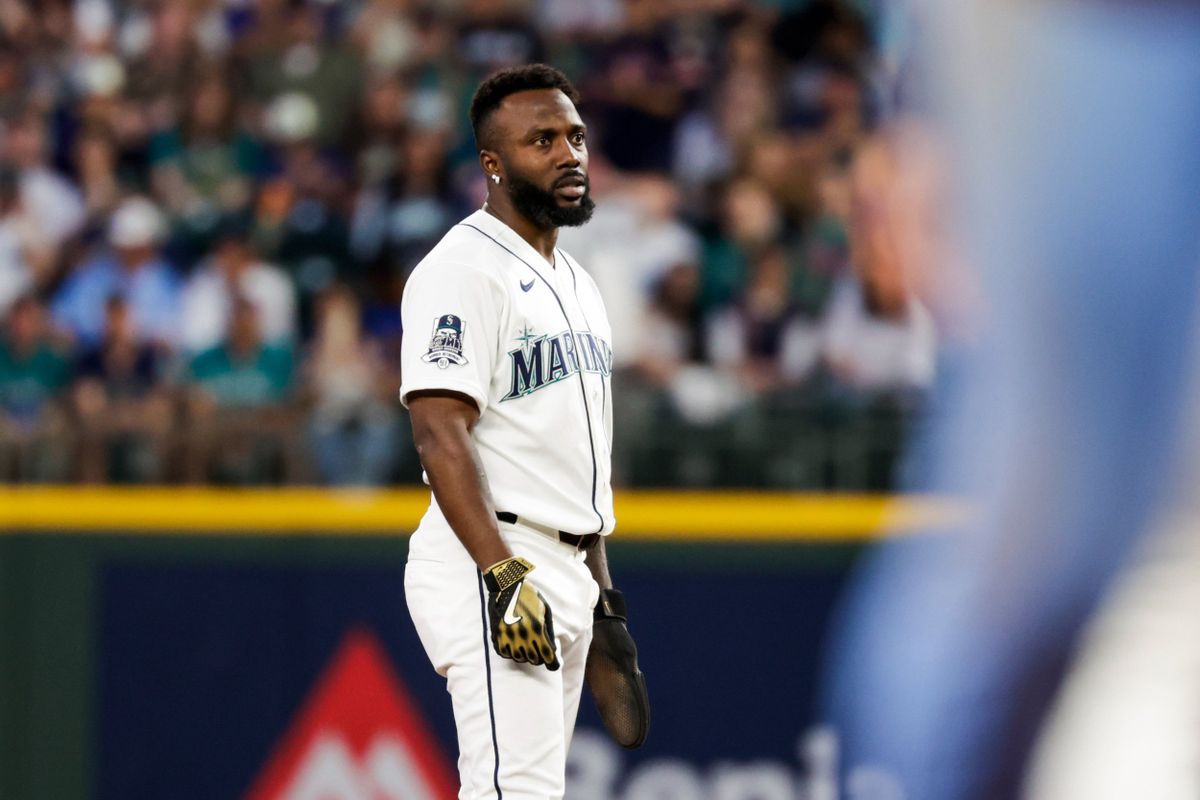
Seattle Mariners left fielder Randy Arozarena (56) reacts after being picked off against the Kansas City Royals to end the fifth inning at T-Mobile Park. Mandatory Credit: Joe Nicholson-Imagn Images [/caption]
If there is to be a moment when the 2026 Seattle Mariners finally put early woes behind them, it will not be for quite some time. The team got swept for the third time in the season, this go around by a Kansas City Royals team that had been 12-19 with a -22 run differential. The first two games were thin margins, winnable for the Mariners, but they weren’t at all able to salvage the third game as hitting and defense broke down once more, a Groundhog Day-like occurrence even as April has turned to May and numbers are piling up in the wins and losses column.
As befits a set of bad losses, the M’s went right up to the edge of victory multiple times, but ultimately let it slip through their fingers. Let’s go over the highs and lows of the series, from mistakes that would be bad in grade school T-ball to a pitching performance worthy of Randy Johnson.
Very High: Emerson Hancock struck out 14 in a seven-inning masterpiece on the night the M’s retired the Big Unit’s number.
Things in this sport can change on a dime, but for now, Emerson Hancock has vanquished all doubts of him being an MLB-worthy starter. He precisely used his four-seamer, sweeper, cutter, and even sinker to fold one Royals hitter after another like his opponents were cheap lawn chairs. By the time he exited the stage at the end of the seventh, 103 pitches to his name and his team nursing a one-run lead, a near-sellout crowd in T-Mobile Park gave him the a roaring ovation.
One in the first, two in the second, two in the third: Hancock began racking up early K’s. He was very effectively playing his pitches off one another and finding pinpoint locations to seemingly every hitter. The only meaningful knocks against him had been a pair of doubles in the third inning, though it must be said that the first was well within Josh Naylor’s range at first and should have been snared for the second out of the frame. Regardless, Hancock got weak contact from Bobby Witt Jr. and froze Vinnie Pasquantino with painted heat.
And while he had started that inning with a bit of a downturn in velocity, as soon as he got into trouble, he started pumping heat once more. That’s how Pasquantino found himself unable to get the bat off his shoulders in what was his second backwards K of the night, the first having come on a frontdoor sinker to the left-hander.
Hancock struck out six of the next seven batters. Salvador Perez found himself fooled silly by a sweeper outside to follow up a sweeper inside, Carter Jensen chased the high heat after laying off a buried two-strike sweeper, Jac Caglianone’s over-aggression led him to chase too many slight balls and, without a clue on the hurler’s sequencing, he went down hacking at a low-and-in cutter - that was the fourth. Though the fifth began with an Isaac Collins single, Hancock dotted the corners against Michael Massey and Kyle Isbel before playing with velocities to get Maikel Garcia way out in front of a middle-middle pitch.
When a pitcher is so utterly dominant, he can get away with stuff like that. It was as if the Royals were in a mental haze whenever Hancock wound up his delivery with two strikes. But it took quite a bit of fortitude to get to that stage; at no point did Hancock let men on base affect his control or pitch selection, as all too often happens when a pitcher resorts to plated sinkers in an effort to work quickly out of a jam.
The top of the sixth featured the most baserunners at any one time for the starter, with Witt and Pasquantino each cracking singles to start off. Incidentally, those came as Hancock did begin to incorporate some more low-middle sinkers into his repertoire. But he immediately snapped back to what had been working before, getting Perez with sweepers away for his 12th strikeout and attacking the following two guys with four-seamers that got hit weakly for inning-ending outs.
This wasn’t the first time in 2026 that Hancock had been twirling a gem through six. But unlike in his first start of the year against the Guardians, when he had thrown 97 pitches of no-hit ball, there weren’t early-season usage limitations or a past-90 pitch count to deal with, and manager Dan Wilson had him go back out on the mound with 89 pitches to begin the seventh.
Hancock’s stuff still played like a vintage three-card monte: Collins flailed at a backdoor 1-2 sweeper and Massey swung at one practically on top of his foot in a two-strike count of his own to become the 14th man Hancock had punched out. The “K” chants began to ring out as he got to two strikes on Isbel, but the nine-hole Royal popped out to end the seventh.
In the Big Unit’s era, there wouldn’t have been a question to send Hancock out for the eighth. But modern baseball takes pitch counts and time through the order seriously, and with the Royals’ top hitters set to face him for the fourth time, his pitch count over 100, and his fastball velocity dipping for real, Wilson went to his bullpen.
In the 50-year history of the Seattle Mariners, Hancock became the first pitcher to go seven innings or more and strike out 14 or more while walking none, hitting none, and giving up one run or fewer. In terms of strikeouts, only Mark Langston, Félix Hernández, Mike Moore, James Paxton, George Kirby, and Johnson himself have hit the 14 mark with Seattle. Moore issued two walks the one time he accomplished the feat and Paxton and Hernández both gave up one base on balls while Langston either walked at least a batter or hit at least one batter with a pitch. Johnson and Kirby both got 14 strikeouts and no walks in exactly one seven-or-more inning start (Johnson’s was 19 K’s in a full nine innings, though he threw 142 pitches), but both gave up earned runs in those outings.
Very Low: Randy Arozarena forgot the count during Cole Young’s bases-loaded at-bat.
And the Mariners lost that game. Hancock was at least given the courtesy of a no-decision, as the final daggers came in the ninth and 10th, but the team could have avoided any talk of blown saves and missed extra inning opportunities had they given Andrés Muñoz even one more run of cushion. The team had gotten one run off of an RBI single from Josh Naylor, but by the fifth inning, the score was tied. Leo Rivas, J.P. Crawford, and Julio Rodríguez all knocked singles to load the bases, though they got more than a bit of help from the Royals defense.
A wild pitch scored the go-ahead run, and the M’s finally had Royals ace Seth Lugo seemingly on the ropes with one out, runners on second and third, and a lead. Lugo was in the midst of gambling that, if he threw enough buried two-strike junk to Naylor, he would be able to get him to chase: this intuition turned out to be correct as Naylor struck out. But he had difficulty finding the zone to Randy Arozarena, and the bases were once again loaded for the man who had been the Mariners’ hero time and again in April, Cole Young.
Young didn’t get a hold of one early, but he had a clear beat on what Lugo looked to do, working back from an 0-2 hole to get the count even. Lugo lost control of a changeup and left it high and outside for ball three. The moment of decision awaited; Lugo would have to cut the Gordian Knot or shatter his sword upon its sinews.
How anticlimactic it would have been for Alexander or his chroniclers if the Knot had come unfurled while the Macedonians argued beside it.
Arozarena, by some inscrutable twist of fate, thought the count had been 3-2. He was taking off on the pitch. Jensen, the Royals’ catcher, happily tossed the ball to second, where Arozarena tried vainly to twist away from the inevitable tag - but the final out was made. Wilson argued that a collision between Arozarena and the second baseman Massey had constituted interference, but said collision had taken place after Arozarena had been ruled out of the baseline, so the inning ended.
High: Julio Rodríguez had a good series with the bat, improving his slash line to .268/.336/.406.
Rodríguez’ best game on offense was on Friday, when he whacked two homers and drove in four of the Mariners’ six runs. But a 2-4 performance with a double on Saturday and a 1-4 showing on Sunday were some of the highlights of a quite dormant M’s lineup in the final two games of the series. His single on Sunday was part of a beautifully executed hit-and-run to get Leo Rivas to third, and Josh Naylor’s ensuing grounder into a force out only scored Rivas due to the play. It was the only run that the M’s got that day.
Since April 11, Rodríguez has slashed .345/.396/.571 with four homers, seven doubles, and three stolen bases. The only nitpick one can have with such a streak is the relative lack of walks, but if all that means is that Rodríguez is driving pitches to hit early in the count, then that’s a tradeoff the Mariners will happily make. It is bound to come down a bit, though, since his .397 batting average on balls in play during that time is highly unsustainable.
Still, Rodríguez’ underlying numbers since that point are very reassuring. He is striking out less than he was earlier in the season (27.9% of plate appearances April 10 and before compared to 18.4% of plate appearances since April 11), he is making a ton more contact in the zone (listed in the following chart as Z-Contact%), he is hitting the ball hard far more often, and he is getting a whole lot more batted balls in the “launch angle sweet spot” of eight to 32 degrees.
[caption id="" align="alignnone" width="1200"]
![Underlying metrics for Julio Rodríguez split by date (April 10 and before vs. April 11 and after). The colored bars represent percentiles while the gray numbers on the sides are the raw numbers and rates. Image courtesty of TJStats. See the footnotes for an explanation of each included statistic [1].](https://storage.ghost.io/c/1d/f2/1df2f77b-83dd-4bc0-a6d2-6d1bb5df89a3/content/images/2026/10/julio_rodr_guez_split_percentiles-281-29-format-original.png)
Underlying metrics for Julio Rodríguez split by date (April 10 and before vs. April 11 and after). The colored bars represent percentiles while the gray numbers on the sides are the raw numbers and rates. Image courtesty of TJStats. See the footnotes for an explanation of each included statistic [1]. [/caption]
An increase in rate of balls pulled in the air (listed as Pull-Air% above) is noteworthy because of how these kinds of hits produce homers. Now, a hitter as purely strong as Rodríguez doesn’t need to pull fly balls in order for them to leave the yard, but it does help. For any hitter, though, pulling fly balls is as much a matter of selection as actual mechanics (though there are hitters like Cal Raleigh who maximize it with a heavy uppercut), and the adage that “homers are thrown, not hit” applies very well to Rodríguez. These numbers are downstream of keeping things simple and putting good swings on balls in the zone, rather than trying to force power.
Low: Julio Rodríguez’ outfield range continued slumping, with evident bad play.
Rodríguez’ failure to cut a ball off on Friday presaged a bad defensive series from the center fielder in every respect except for throwing, where he did alright. But when it came to ranging to reach difficult plays or picking balls up from the outfield, the Mariners’ star didn’t have any hard power to back up his no fly zone.
With Muñoz fighting to contain Salvador Perez on second in Saturday’s ninth inning, Jac Caglianone roped one into center field. Perez, a fairly slow runner, rounded third as the ball reached Rodríguez; a strong throw would be enough for the play of the game. But he at the very least needed to haul the ball in - something he didn’t do, as he rushed his glove up and the ball went right through the wickets all the way to the wall. It took a mountainous effort to keep Caglianone from rounding third, but the damage was done and the save was blown.
Low: The Mariners infield was functionally unable to execute a relay play, tag at the plate, or even a semi-complex pickoff.
Again, Rodríguez’ arm was fine. In the top of the fourth on Sunday, he made a solid throw to gun down Perez trying to tag up for the third run of the inning, reaching catcher Jhonny Pereda in time and dead on the money despite a couple of hops. But Pereda didn’t get his glove out in time, seemingly uncertain whether he could cleanly tag Perez with just one hand, and Perez evaded the tag. Despite being initially ruled out, Kansas City called for the challenge, and the call was easily overturned.
Rodríguez had delivered a throw in the top of the 10th on Saturday night as the ghost runner Massey tagged up from third with one away, but it was slightly off line and needed to be perfect with Massey’s speed. The only reason Massey was at third to begin with, however, was that Mitch Garver had thrown to the wrong base during the previous at-bat as Massey was caught between second and third and, with the opportunity for the pickoff still there, J.P. Crawford couldn’t get the ball out of his glove. That run was the game-winner.
Yet another run came home in the top of the sixth due to a bad relay, as Collins cracked a double to deep center and Rodríguez got it from the wall to the infield. Had Young made a good throw home, Pereda would have had plenty of time to make the play, but he bounced it a bit up the line and Pereda couldn’t get his glove on it.
They did get a free out from their ineptitude in the top of the ninth on Sunday, as Isbel tried to go from first to home on a single. Though he caught Young off-guard, the second baseman recuperated himself in time to deliver a dime to home and the M’s finally made a relay play.
Low: Seattle’s offense fell silent in the second and third games as home runs didn’t show up.
Seattle’s six runs on Friday were all courtesy of the longball, but for the remaining two games, neither team left the yard. Aside from Naylor’s first-inning single on Saturday, the M’s didn’t get any hits with runners in scoring position, though it’s not like they produced many of those to begin with.
It seemed like the batsmen up and down the lineup fell into the same haze that Hancock had put on the Royals, except this time, there wasn’t any difference whether it was the strong Seth Lugo, the capable Kris Bubic, or the struggling Luinder Avila; they had little ability to put knocks together against anyone.
Part of it was lineup construction. With Brendan Donovan out with injury and Young moved up in the lineup, the bottom of the order didn’t have enough reliable contact to guarantee that the ghost runner in the bottom of the 10th could be moved up. Neither Garver nor Rivas could put one in play in that inning, as Royals closer Lucas Erceg correctly intuited how to use secondaries when the M’s were primed to swing and fastballs when the M’s were primed to take.
Seattle had a .160 expected batting average on Sunday and underperformed even that with a 4-30 showing. Of 14 batted balls of 100 miles an hour or greater, 11 belonged to the Royals. Little else needs to be said.
Low: Seattle’s (lack of) ABS challenging cost them 1.24 (or more) run expectancy on Sunday.
You’re already 2,500 words into this article and you might be wondering how many lows are left. They got swept; there are plenty of lows, but this is the second-to-last that will be discussed here.
Sunday’s batting performance was already woeful, but they might have been able to put a bit more pressure had they remembered what situations to use their challenges in. Home plate umpire Clint Vondrak called the following balls as strikes against the Mariners: a 3-2 pitch to Rob Refsnyder with a man on first and nobody out in the third, an 0-1 pitch to Connor Joe with one out and a man on first in the fourth, and a 1-1 pitch to Pereda with two outs and nobody on in the seventh.
Four pitches over the plate ended up called as balls against a Mariners pitcher: two in the third to Maikel Garcia with a man on and two outs (on an 0-0 and 2-1 count), an 0-0 pitch to Massey with one on and nobody out in the same inning that barely clipped the zone, and a 1-1 pitch to Isaac Collins with runners on first and third and one out in the top of the eighth.
Now, some of these pitches were in situations where challenging wouldn’t have been very worth it: in order for challenging to be an even expected value play, Joe would have had to be 65% sure of an overturn and Pereda would have had to be 82% sure in his at-bat, though obviously most people can’t estimate to that level of granularity. At the dish, Pereda would have had to be 78% confident on the 0-0 pitch to Garcia and 62% confident on the 2-1 pitch, while the first pitch to Massey only touched the strike zone by a hair and he would have needed to be 63% confident anyway.
The two that really mattered from a run expectacy standpoint were Refsnyder’s missed challenge in the bottom of the third and Pereda’s missed challenge in the top of the eighth.
Teams score an average of 0.53 runs when they have a runner on first with one out, but they score an average of 1.52 runs with runners at first and second and no outs. That was the difference that a Refsnyder challenge would have made. Balanced against the 0.2 run expectancy gain of an average challenge (and thus the run expectancy loss of missing a challenge), he only needed to estimate a 17% chance of an overturn for the expected value to break even.
The run expectancy change from the eighth inning miss was a smaller 0.25 - and despite Collins’ walk, Cole Wilcox worked out of the frame with a double play - but it still had a break-even confidence level of 45%.
Seattle wasn’t the only team to fail to challenge a bad full count call: Vondrak called a 3-2 strike to Joe as ball four with a man on and a man out in the bottom of the second and the Royals didn’t challenge.
The lesson is simple: the vast majority of full counts occur in situations where challenging most close pitches is worthwhile. The highest break-even confidence level is when the count is full with two outs and nobody on; even then, it is 47%. All other full count break even confidence levels are 31% or less, meaning that the challenging team can break even despite being right less than a third of the time in those situations.
The Mariners’ actual run expectancy loss was a bit higher than 1.24 runs, as estimated confidence level can be inferred by distance from the edge of the strike zone - this is because umpires’ accuracy rate increases in a profoundly regular fashion as distance from the strike zone increases.
Umpire Called Strike Rate
v Overturn on ABS Challenge
First notice on 50/50 calls Umps are exactly 50/50
Second: see how pitches 4+ inches outside are overturned 100% to Balls? On pitches 2-3 inches, that's only 60%. Why? Because the other side is challenging legit called balls pic.twitter.com/8N0AGBNd5m— Tangotiger 🍁 (@tangotiger) April 8, 2026
Low: The M’s have to face the sizzling Atlanta Braves and are in real danger of dropping to 16-22.
The best team in the sport right now is the Braves, who lead all MLB in both record (25-10) and run differential (+81). Their pace will almost certainly slow down somewhat in the course of the season, but they are about the last team a struggling Mariners side wants to be up against as they scrape and scratch to try and get back to .500. A team with World Series aspirations having to fight for the benchmark of mediocrity in May is nothing new in the sport, though the Mariners have a luxury not afforded to Senior Circuit squads due to the fact that the American League contains only two good teams right now, both of which (the Yankees and Rays) are in the AL East.
Seattle’s +2 run differential is actually the fourth best in the AL, to give an idea of how bad Ban Johnson’s league has begun the year.
Being four games under in early April was one thing, but if the Mariners get swept, they would be six games under on May 6. Granted, the chances of that are fairly low from the outset. For whatever reason, FanGraphs gives Seattle very good odds of winning each game against Atlanta (with the Cinco de Mayo contest being Atlanta’s best chance of victory at 41.8%) and so the chances of sweep according to the site are a 6.5% chance of the Braves taking all three and a 21.3% chance that Seattle does so. Even Neil Paine’s model, which gives the Braves a 1540 Elo to the Mariners’ 1517, has Seattle as slight favorites (50.1% to 49.9%) on Monday night.
Based on the way these teams are playing, it would seem that the Braves have a giant advantage. The thing about streaks, however, is that they are liable to end at any time.
Other notes: Two players made Mariners debuts while Cal Raleigh suffered a knock.
There are many, many things not fully covered here, but I thought it would be prudent to go over some of them briefly.
- Reliever Nick Davila had his MLB debut on Sunday, pitching a full ninth inning with no runs allowed despite a walk and no strikeouts. He threw 16 pitches, nine of them strikes.
- Pereda’s game on Sunday was his first game with the Mariners. While he struggled to make tags at the plate, he showcased some stellar pop time and throwing to second to nab Collins on a stolen base attempt at second.
- Cal Raleigh suffered what is being called “side soreness” during the game on Friday and did not play on Saturday or Sunday. While an IL decision has not been made, the Mariners catcher said that he will be taking it slow.
[1] wOBA is weighted on-base average, a catch-all hitting statistic where each outcome is given a specific weight. In effect, it is a more precise version of OPS that is scaled to on-base percentage; for a comparison, Cal Raleigh had a .392 wOBA in 2025 while Rodríguez’ was .341. xwOBA is the “expected” wOBA based on launch angle and exit velocity.
“EV” in each metric stands for exit velocity, and so average EV and maximum EV are self-explanatory. 90th percentile EV is the exact exit velocity of the 90th percentile hardest hit ball.
Bat speed is self-explanatory but do note that it is custom to exclude the bottom 10% of swings from the average. Note that TJStats’ split tool does not do this while the overall numbers given on the main TJStats page do.
Barrel rate (expressed as Barrel%) is the percentage of batted balls with an expected batting average of .500 and above and an expected slugging of 1.500 and above. Note that, as with xwOBA, expected stats don’t incorporate hit direction or fielders, only exit velocity and launch angle.
“LA” stands for launch angle, so “LA Sweet-Spot%” is the percentage of batted balls between the aforementioned eight and 32 degrees.
“Z” and “O” stand for in-zone and outside of zone respectively. “O-Swing%” is sometimes expressed as “chase rate”.