Assessing Three March Mariner Concerns Ahead of 2026 Regular Season

If the Seattle Mariners started the 2026 regular season 6-16-1 (ignore the tie), things would probably be nearing panic mode in T-Mobile Park. But given that it’s Spring Training, the record isn’t all that concerning as Opening Day begins. But from injury concerns to slow starts for stars, there are some points of worry for the M’s as the season comes into view. Just how worrying are these signs, however? Is there any meaning to be derived from them?
Concern 1: Injury questions for players up and down the roster.
Concern level: 4/10
The most-discussed injury question for the upcoming season has been Bryce Miller, and it seems likely by this point that he won’t be ready to start the regular season. The Mariners have Emerson Hancock and Cooper Criswell both available to fill in the fifth starter role - and I personally expect they’ll start with Hancock, with Criswell in the tank if Hancock again struggles as a starter - but they at least have some good indications due to both players’ performance in Spring Training. That doesn’t necessarily mean much for the regular season, especially in the top-line stats such as ERA and FIP, but the M’s have to be impressed with Hancock’s feel for the ball.
There are other injury concerns, too. J.P. Crawford has been dealing with some shoulder soreness, but he’s scheduled to be back Tuesday for one of the team’s split-squad games (some of the team will be facing the Rockies and some of the team will be facing the Padres). Miles Mastrobuoni is dealing with calf discomfort, reportedly something he had hoped was just a cramp but that had ended up lingering.
Julio Rodríguez had a brief injury scare after taking a Paul Skenes fastball off the wrist in a World Baseball Classic game but diffused any concerns by robbing Aaron Judge of a homer in the next half inning, so that episode is all but forgotten.
Most disappointing, though, might be hamstring tightness for Brennen Davis that took him out of the game on Saturday, a bad sign for a player who has dealt with injury troubles all throughout his minor league career. From what I can gather, it seems like a minor issue at present, but the M’s are likely going to take it slow with a guy who had been tearing up the diamond in Spring to make sure it doesn’t worsen.
Given the fact that Davis and Mastrobuoni are on the outer edges of the depth chart, there isn’t a worry for immediate team performance as much as there is for depth going into the middle months of the year. Bryce Miller’s injury troubles are more serious, as it forces one of Criswell or Hancock to perform up to the standards of a big league starter lest the M’s have a bullpen day every fifth game. Seattle’s lack of a true fifth starter was a noted concern going into the season, and probably the one that’s closest to haunting the Mariners by this point. Crawford’s shoulder discomfort could also become an issue if he misses serious playing time, as it would force a similar situation on Colt Emerson and Leo Rivas, but his troubles appear comparatively minor at the moment.
Concern 2: Terrible top-line results.
Concern level: 2/10
Spring training games don’t have a whole lot to do with the regular season when it comes to the line score, this much is time-honored baseball wisdom for a reason. But the M’s are dead last in the entirety of Spring Training so far with the worst run differential (-54) of anyone in either the Cactus or Grapefruit Leagues. Does a Spring Training performance that bad merit worry?
After all, this is the Mariners we’re talking about. FanGraphs’ projection system has the M’s at 62.3% to win the division while PECOTA gives an even rosier 73.9% chance, but betting markets are still giving the Mariners true odds of around 45% [1] while prediction markets have the M’s at around 50/50 true odds of winning the division. If the projection systems are correct, that means bettors are leaving a lot of expected value on the table [2]. A one-timer division winner bet doesn’t attract as many professionals, sure, but a discrepancy this big means that people with money on the line are incorporating other factors.
Teams like the Astros and Brewers, for example, tend to outperform their preseason projections (PECOTA projects the Brewers to an average of roughly .500, something that’s plainly off), and that’s priced in. But these odds haven’t changed much across Spring Training, and they’ve actually improved for the M’s in the betting markets. So how much do Spring Training records and run differentials matter?
The answer is that it matters a little bit. Taking a fuller picture of the data, Spring Training run differential is weakly correlated with regular season run differential, though the effect is minimal.
[caption id="" align="alignnone" width="1500"]
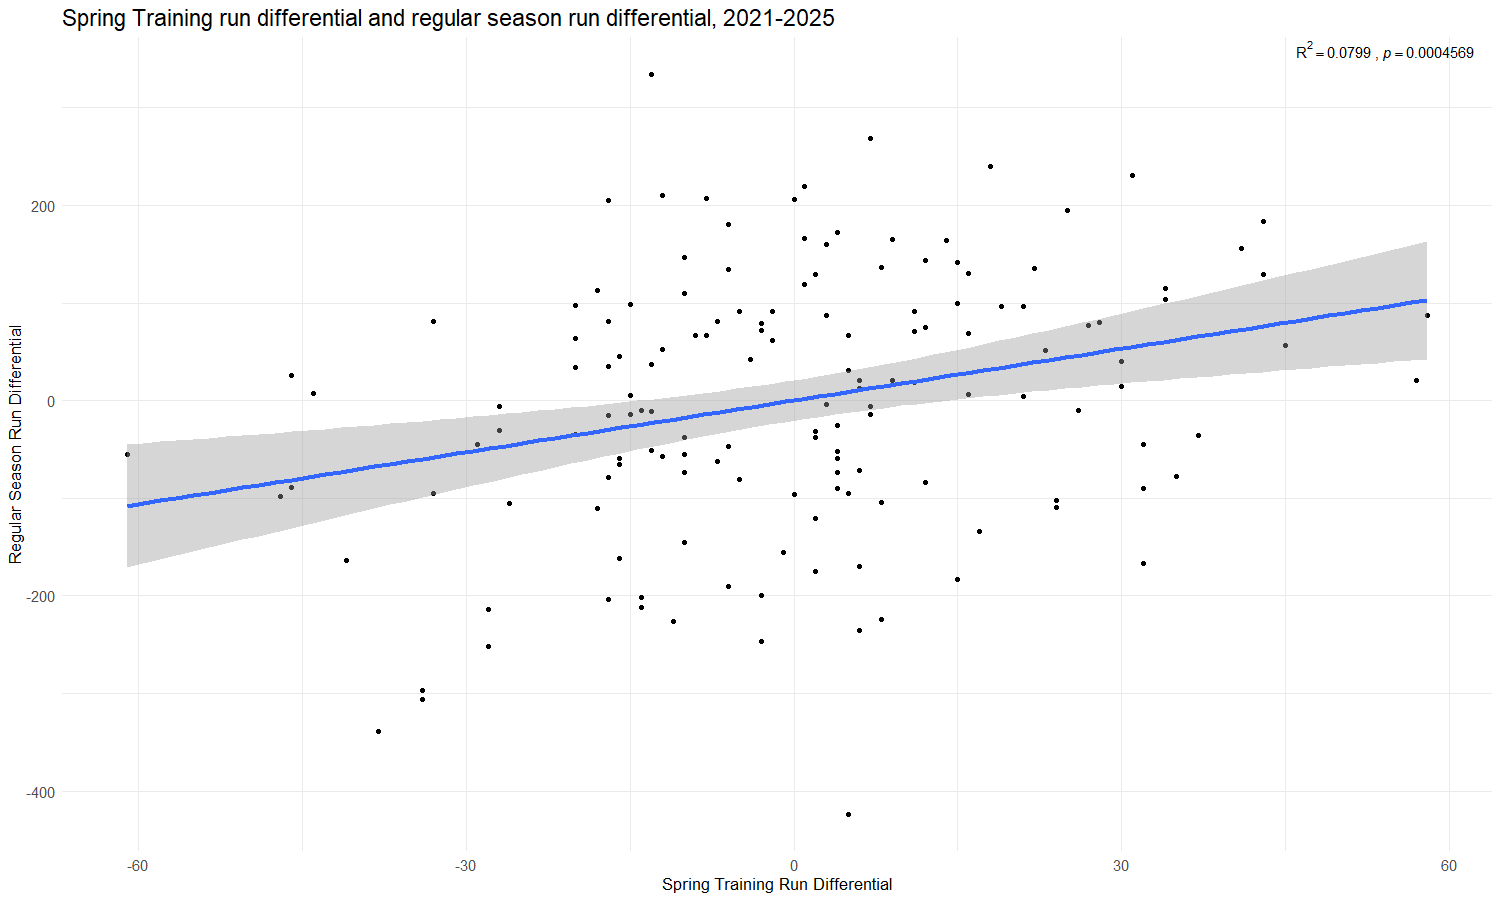
Spring Training run differential has some effect on regular season run differential in the aggregate, but it’s very minimal for each individual point. Data sourced from thebaseballcube.com and compiled using RStudio. [/caption]
The r-squared value of 0.0799 means that the differences in Spring Training run differential account for 7.99% of the differences in regular season run differential. The correlation is even weaker between Spring differential and regular season winning percentage, where the r-squared value is 0.0381.
For comparison - to give an example of a strong statistical relationship - regular season run differential and regular season winning percentage between 2021 and 2025 produced a 0.903 r-squared value: in layman’s terms, that means that a team’s run differential accounted for 90.3 percent [3] of a team’s winning percentage! The light correlation between Spring performance and regular season performance shouldn’t worry Seattle that much.
But what about teams that got pummeled in Spring? Since 2006, the first year with full run differential data in Spring, the 13 teams (not including the ‘26 Mariners) that have suffered a -50 or worse run differential in Spring Training [4] wound up winning 987 of their 2268 regular season games, giving a winning percentage of .435; overall, these teams ended up quite a bit worse than league average. The best team among that sample was the 2008 Phillies, who won 92 games and the World Series that year, but 10 of the 13 (77%) failed to make the playoffs at all.
[caption id="" align="alignnone" width="1500"]
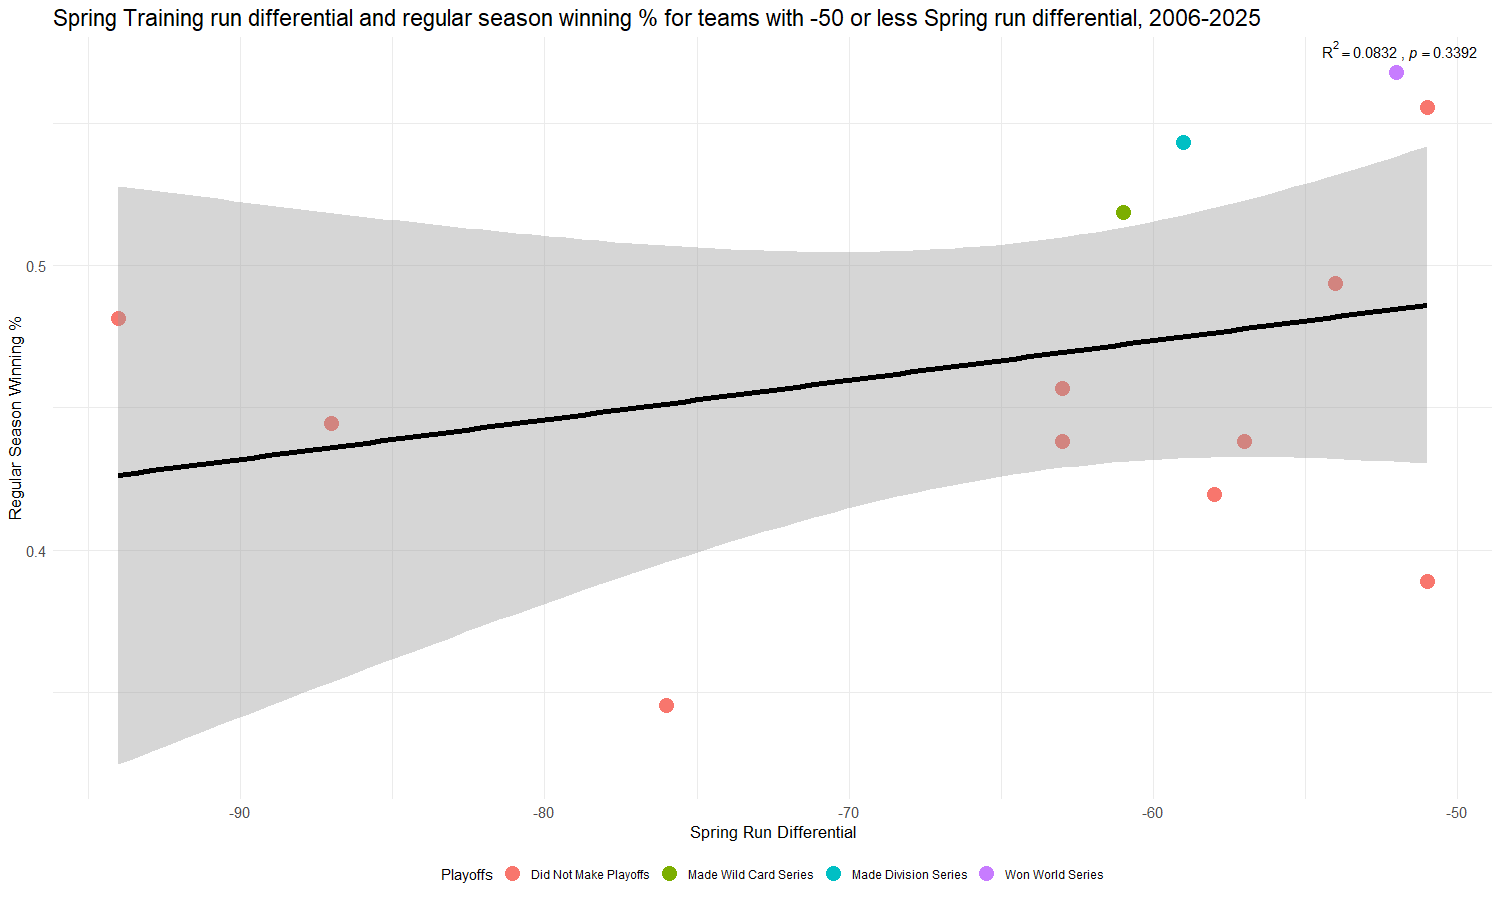
Teams on the extreme low tail of Spring run differentials mostly didn’t make the playoffs, but the correlation between differential and winning percentage was statistically insignificant. Data sourced from thebaseballcube.com and compiled using RStudio. [/caption]
There are reasons to not put too much stock in this, either. The data set is so small that despite a higher putative explanatory value (roughly 8% between Spring differential and regular season winning percentage compared to roughly 4% in our overall 2021-2025 sample), the correlation is statistically insignificant. Five of the 13 teams had players competing in a concurrent World Baseball Classic like the M’s do in 2026, and those teams had a notably higher .490 regular season winning percentage. Spring Training has yet to conclude, and it’s quite likely Seattle’s record and differential will even out a bit before Opening Day.
Compared to very real (although presently somewhat subdued) injury worries, the team’s Spring record and differential simply doesn’t mean much.
Concern 3: Key players have been slumping in the WBC and Spring Training.
Concern level: 1/10
Some of the team’s biggest stars haven’t shown up as much as the M’s would like during play so far. Cal Raleigh is hitless so far in the WBC, though his four walks and one hit by pitch in 14 plate appearances have given him a .357 on-base percentage. Julio Rodríguez started off with an early homer but finished the WBC with just three hits in 17 at-bats. Gabe Speier has given up two home runs in 2 ⅓ innings pitched, ballooning his Classic ERA to 7.71 even with a sub-1.000 WHIP. Dominic Canzone has hit .188 for Team Italy.
The concerns about players in the WBC slumping for a grand total of six games are basically meaningless, at least where the regular season is concerned. I had to omit Canzone’s on-base (.350) and slugging (.375) to make his line even appear all that bad.
You could draw conclusions about ability in the clutch from these World Baseball Classic games, but even then, there isn’t much to be worried about. Rodríguez’ biggest WBC appearance was in the bottom of the ninth against Mason Miller with the Dominican Republic down by a run, and he simply drew a five-pitch walk. We’ve also seen these players (aside from Canzone) perform in the big stage of the 2025 playoffs, so concerns about lack of the clutch gene should be a bit muted in my view.
Spring Training has has a much bigger (though still small) sample size, so there is a bit more to take away on that front. Luis Castillo is probably the most notable straggler in Cactus League play, with a 15.00 ERA and 2.667 WHIP through six innings pitched in three Spring outings. But when it comes to stats in the Cactus or Grapefruit Leagues, the more important and predictive things to keep track of are the underlying statistics: strikeout rate, walk rate, called strike plus whiff rate (CSW%), chase rate, hard hit rate, and so on. Castillo actually has a strong whiff rate (33.8%), chase rate (37.3%), and roughly average CSW% (27.8%) during Spring Training, though his 61.5% hard hit rate is worrisome and his ground ball rate has decreased a bit from the 2025 season.
Castillo did outperform some of his underlying data in 2025 and was always going to be at risk of notable regression in 2026, and so he is probably the only player I’m at least marginally concerned about among the list of Spring slumpers. But it’s not like he’s set to turn into a complete liability this year (though of course that is possible), so until that looks likely, the panic button can remain as dusty as a crooked dealer’s top card.
[1] Implied odds as derived from the betting lines add up to more than 100%, this is the house edge.
[2] Doing the math on a bet that pays out as if it’s a 50/50 shot but is actually a 75% chance - I’m simplifying - comes out to an expected profit of $0.50 for every dollar bet.
[3] Even run differential is infamously imperfect over a whole season, as the 2016 and 2021 Mariners can both attest. That extra 10% or so still matters!
[4] The list of teams with a -50 or worse run differential in Spring Training is as follows: the 2006 Chicago White Sox (-51), the 2006 Washington Nationals (-63), the 2006 Seattle Mariners (-94), the 2007 Florida Marlins (-57), the 2008 Philadelphia Phillies (-52), the 2008 San Francisco Giants (-87), the 2009 Houston Astros (-63), the 2011 Houston Astros (-76), the 2012 Cleveland Indians (-58), the 2015 Philadelphia Phillies (-51), the 2015 Texas Rangers (-59), the 2018 Los Angeles Angels (-54), and the 2023 Miami Marlins (-61).