Analysis: Is Mariners’ Cal Raleigh on Pace For Greatest MLB Season By a Catcher?

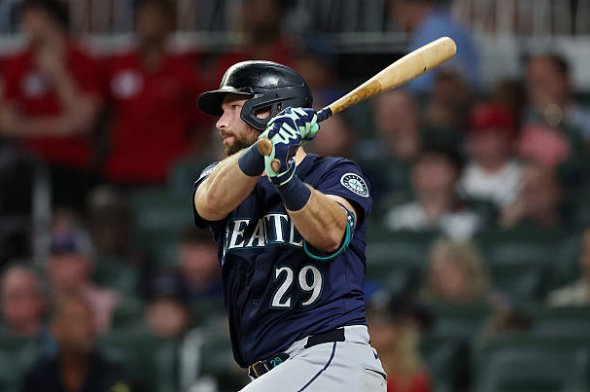
There is no doubt that Seattle Mariners slugger Cal Raleigh has had one of the best first halves of any catcher in MLB history. In fact, his numbers through just one half of play would dwarf full seasons by most catchers.
He’s not only on pace to blow the doors off Salvador Perez’s record 48 home runs for a catcher in a season, as Raleigh also is on pace to break the American League record for home runs (62) in a season by any player. He’s doing this all while being a strong defensive catcher and posting an OPS over 1.000, doing everything he can to elevate Seattle back to the playoffs.
But is Raleigh truly on pace for the greatest catching season of all time? To figure that out, I am going to look at four all-time great catching seasons: Buster Posey in 2012, Mike Piazza in 1997, Gary Carter in 1982, and Johnny Bench in 1972. There are other seasons that are also up there with the best – such as Darrell Porter’s 1979, Roy Campanella’s 1953, and Joe Mauer’s 2009 – but they simply don’t quite compare to the other four and what Raleigh is doing right now.
Posey’s 2012 campaign is the most recent of these seasons under the microscope, thus being the one we’ll start off with. Playing for the San Francisco Giants, he led the National League in both bWAR (7.6) and fWAR (9.8). On offense, Posey slashed .336/.408/.539, hit 24 home runs, scored 78, and knocked in 103. His OPS+ was 171 (where 100 is league average) and his wRC+ (weighted runs created plus, where 100 is league average) was 164.
On the other side of the ball, Posey caught an MLB-leading 38 runners stealing, which was 30.4 percent of all runners who tried to beat his arm (compared to a 2012 league average of 26.5 percent). Posey caught a starting pitching staff of Tim Lincecum, Madison Bumgarner, Matt Cain, Barry Zito, and Ryan Vogelsong, who had an average ERA of 3.77.
Posey’s San Francisco Giants won the World Series that year, sweeping the Detroit Tigers.
Next up is Mike Piazza’s ridiculous 1997 season. The primary catcher for the Los Angeles Dodgers that year, Piazza was third in NL bWAR (8.7) and was tied for second in NL fWAR (9.1). This season is often considered one of the best offensive seasons by a catcher, as Piazza slashed .362/.431/.638, hit 40 home runs, scored 104, and drove in 124. His OPS+ was 185 and his wRC was 183.
Comparatively, Piazza’s arm was less formidable than Posey. Although he caught 43 runners stealing, that was just 27.7 percent of all runners who ran on him, lower than the league average 31.7 percent caught stealing rate (numbers that, compared to Posey’s, show how much the game had changed in 15 years). He caught a staff of Hideo Nomo, Ismael Valdéz, Chan Ho Park, Pedro Astacio, Ramón Martínez, and Tom Candiotti, who had an average ERA of 3.60.
Piazza’s Dodgers did not make the playoffs that year, finishing 88-74 – two games back of the Giants for the NL West title.
Gary Carter’s 1982 ranks among the elite catcher seasons, though it was perhaps underappreciated outside of Quebec. Then a Montreal Expo, Carter was first in the NL in bWAR (8.6) and second in the NL in fWAR (8.4). He slashed .293/.381/.510, hit 29 home runs, scored 91, and knocked in 97. His OPS+ was 151 and his wRC+ was 150.
Carter’s defensive stats were also impressive. He threw out an MLB-leading 70 runners on the basepaths that season, amounting to 40.5 percent of all attempts (compared to a league average of 31.6 percent). His strong defense combined with his incredible offense – best for a catcher that year – to produce one of the best all-around catcher seasons ever. He caught a phenomenal Expos staff of Steve Rogers, Bill Gullickson, Charlie Lea, Scott Sanderson, and David Palmer, starters who combined for an ERA of 3.17.
Carter was awarded a Gold Glove and Silver Slugger at the end of the season, but finished only 12th in National League MVP voting. Perhaps that was because his Expos finished in third place in the NL East at 86-76, six games behind the Cardinals.
That brings us to 1972 for Johnny Bench. One of the key pieces of the ‘70s “Big Red Machine,” Bench was second in National League in bWAR (8.6) and second in fWAR (9.2). He slashed .270/.379/.541, hit 40 homers, scored 87 runs, and knocked in 125. His OPS+ was 165 and his wRC+ was 156.
And Bench was a stalwart defensive catcher with a sterling reputation. Just 55 baserunners attempted to run on Johnny Bench in 1972, and 31 of those (56.4 percent!) were thrown out. Bench caught the Reds’ six-man rotation of Gary Nolan, Ross Grimsley, Jack Billingham, Jim McGlothlin, Don Gullett, and Wayne Simpson, a starting pitching staff with an average ERA of 3.38.
Unlike Gary Carter 10 years later, Bench was at the front of MVP voters’ minds. The Big Red Machine made it to the World Series that year (losing to that other ‘70s juggernaut, the Oakland Athletics) and he was awarded the National League MVP.
Now let’s start digging into Raleigh’s stats. He’s currently second in the American League in bWAR with 4.8 and second in fWAR with 6.2. He’s slashing .259/.376/.634, has hit 38 home runs, scored 65 times, and drove in 82 runs. His OPS+ is 190 and his wRC+ is 178.
On the other side of the ball, Raleigh has thrown out 15 runners out of 46 that have attempted to steal on him – or 24.6 percent. It’s worth noting that here, it’s hard to compare him with anyone other than Posey, as the game has changed a lot in the third millennium in terms of stolen base strategy. Less runners try to steal, and those that do attempt it are often only the very fastest. Raleigh here is above the league average of 22.3 percent.
Now it’s time to compare the five seasons we have at hand to see which one stacks up to be the best. Obviously, Raleigh has only played 96 games out of 162, but there will be pace comparisons so that we can see how it shapes out.
Let’s start with the batting stats. Although we’re working mostly with 162-game pace here, I’ll compare his first half stats with Posey, Piazza, Carter, and Bench at the All-Star Break in each of their seasons.
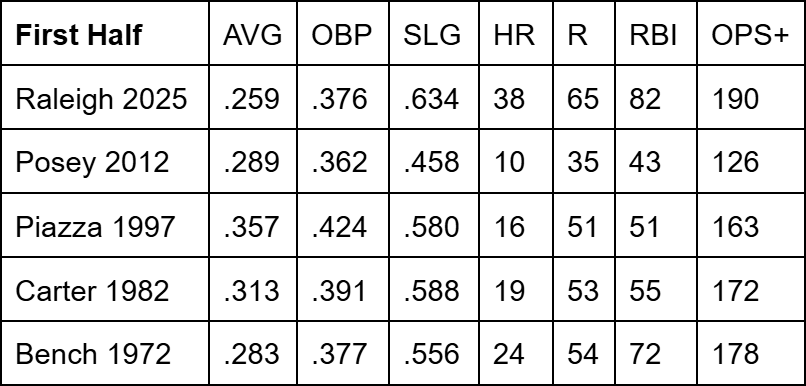
We can see that Raleigh has a home run total and slugging percentage that is not only better than the other first halves, but that blows the other first halves out of the water. Even Carter and Bench, who in their all-time seasons were better in the first half, don’t come very close to Raleigh. And the OPS+ numbers, which take into account the years that each catcher played in, show that Raleigh is far and away dominating his competitors when it comes to total offensive output.
Now let’s look at the pace numbers compared to the full seasons of the four other catchers. Obviously, Raleigh will not replicate exactly what he did in the pace of his first half in his second half. From our four other examples, two (Posey and Piazza) heated up in the second half; two (Carter and Bench) cooled off. I’d wager on Raleigh cooling off – given how unbelievably cyclopean his first half has been – but it’s entirely possible the Mariner catcher plays better in the second half.
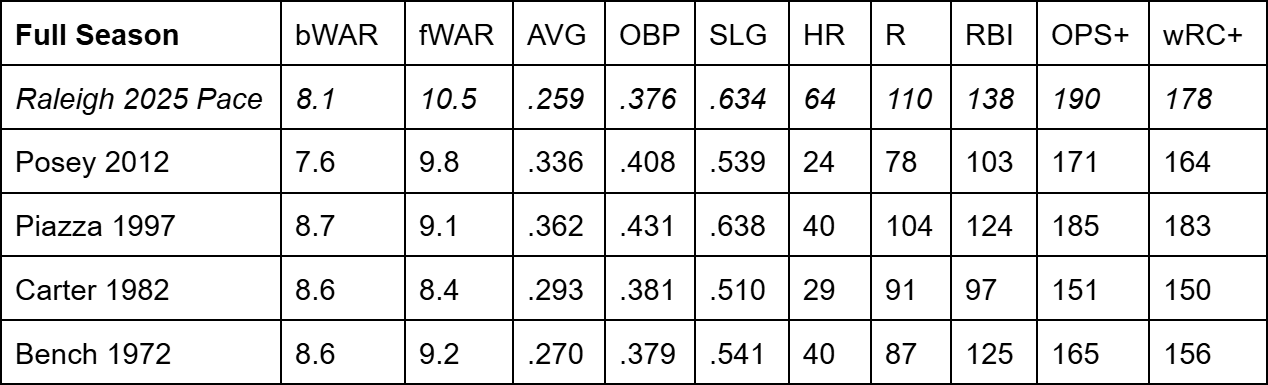
From these numbers, an interesting pattern emerges. Raleigh’s bWAR pace would put him fourth on this list, but his fWAR pace puts him first. Interestingly, the only catcher in this list below him in bWAR – Buster Posey – is also the catcher with the highest fWAR in a recorded season. This boils down to defensive value and the way it is determined.
Defensive value is the most difficult value stat to evaluate, and catching value is the most difficult defensive value to determine. There is throwing runners out, blocking, pitch framing, regular fielding, and game management. For catchers, bWAR uses Defensive Runs Saved – which includes Stolen base/caught stealing data and pitch framing data for catchers – in 2003 and beyond, while it uses Total Zone Rating pre-2003. For catchers, TZR only considers throwing data. Meanwhile, fWAR considers stolen base prevention (based on Stolen Base Runs), fielding, and blocking (based on Runs on Passed Pitches), as well as pitch framing for recent seasons.
What no value measuring system yet does is measure game management. CERA (catcher ERA, the ERA of pitchers while a particular catcher is behind the plate) is a rough metric, but it has a ton of yearly variation to the point of not being a predictive measure. I suppose you could also look at (especially relief) pitcher performance in high leverage situations split by catcher, but that also has obvious blind spots and would probably have similar reproducibility issues.
According to bWAR, Raleigh’s defensive value is negative compared to a replacement player: Baseball-Reference has his defensive WAR (dWAR) at -0.4 (pacing -0.7). Comparatively, the dWAR numbers for the other seasons are as follows: Posey 2012 at 0.8, Piazza 1997 at 0.5, Carter 1982 at 2.8, and Bench 1972 at 2.4.
FanGraphs doesn’t display its version of defensive WAR directly; the closest thing it has is Defensive Runs Above Average. While Runs Above Replacement is what is used in the calculation of WAR, Runs Above Average measures his production above an average player, not a replacement player. Still, we can compare the defensive RAA of all five seasons. Raleigh is at 9.6 defensive RAA (pacing 16.2), Posey had 32.8, Piazza had 5.5, Carter had 23.3, and Bench had 20.0.
So, according to the FanGraphs data, Raleigh is having a strong defensive catching season, though not among the greatest of all time. It’s worth noting that while the Baseball Reference data shows a down year for Raleigh defensively, the FanGraphs data is very similar to his historical range.
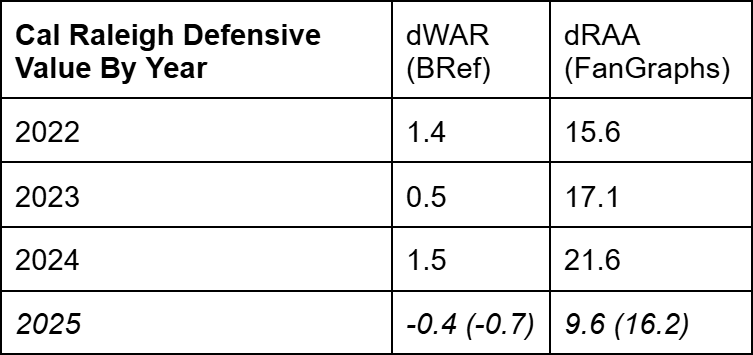
Raleigh’s defense last year was good enough to win him the Platinum Glove Award, but this year is still in line with his first three excellent defensive seasons according to FanGraphs.
This also fits what we’ve seen from Raleigh regarding the eye test – which is still a useful (although subjective) tool when looking at defense. He has looked strong all year, though not quite Platinum Glove level to this point. He does appear to have a potential weakness on tags at the plate, but in all the other fundamentals – blocking, throwing, game calling – he is outstanding.
It’s for this reason I’m going to trust the FanGraphs defensive data more on this issue. I haven’t seen anything from him that indicates a massive drop defensively like his bWAR appears to show.
But I do want to look at the base stealing data in a little bit more detail. Stolen base data is relatively easier to compare across historical seasons as compared to pitch framing, where data is only available for recent years. But there’s still two things to consider: the league average caught stealing percentage and the amount of runners that ran on a specific catcher compared to the league average catcher.
For example, a runner choosing not to steal second because he fears a strong catcher’s arm can be very valuable for the pitching team.
Of course, league differences in both can be stark. Carter’s 40.5 percent was fourth best in the NL for a qualified catcher, while Bench’s 56.4 percent was NL-best.
You can also see the chilling effect at work: 0.43 runners tried to run on Bench per nine innings, while the NL average was 0.81. While the 1.15 steals attempted per nine against Gary Carter in 1982 was well below that year’s average of 1.34, it was not as remarkably suppressed: the steals attempted per nine against (I’ll call it AttSB/9 for the rest of this article) Bench in 1972 was zeroth percentile in the National League – meaning that baserunners in the NL ran on him less than any other catcher – while Carter’s 1982 AttSB/9 was about 14th percentile, meaning that NL baserunners ran on him less than they did for 86% of other catchers.
To give you a sense of how much the league had changed in 10 years, Carter’s 1.15 attempted steals per nine against would have been about 94th percentile had you plopped him in 1972. The ‘80s were truly the heyday of the stolen base.
Here comes the defensive data compared. *Do note that, in the percentile rankings, I have only considered catchers with 100 or more innings (or in Raleigh’s case, catchers with 60+ innings).
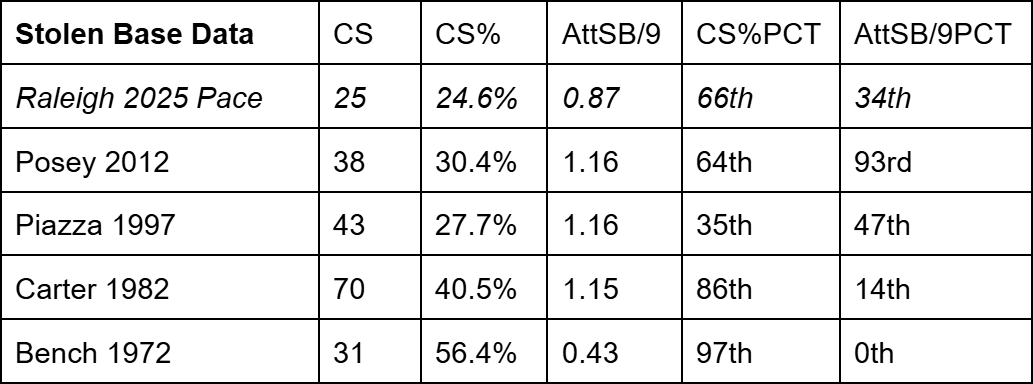
This data explains some of the stolen base stats we saw earlier. Buster Posey in 2012 had an above-average caught stealing rate, but runners tested his arm more than 93 percent of NL catchers that year, so he ended up with a league-leading 38 runners gunned down.
We can see from the throwing data that runners try to swipe bags on Raleigh a little less than the average AL catcher in 2025, while he throws out runners at a clip somewhat better than the average AL catcher in 2025.
This is a bit of an undersell when compared to the FanGraphs data on Raleigh’s stellar defensive value, but you must also consider that the FanGraphs data is incorporating pitch framing as well – where Raleigh also shines this year.
The Verdict
To recap, Raleigh is on pace for a league-adjusted overall offensive production around that of Mike Piazza’s 1997 – the best batter of the four comparisons – while maintaining an elite (or at least very strong) defensive level, though perhaps not as good as Bench or Posey.
The big “if” is his batting production, which completely blows the doors off any season he’s had previously. I’m not super concerned about his ability to continue his defensive output – we’ve seen him be this good on that side of the ball before. But unfortunately, it’s very probable we get some regression to the mean with the bat.
But this is about whether Raleigh is on pace for the greatest catching season of all time. I think that answer is a yes, even when you start splitting hairs about best vs. greatest.
For best, we can look to his wRC+, and OPS+ – both some of the best a catcher has ever had – combined with his strong defense. For greatest, there is usually some element of novel historicity or legacy or championship. Usually this is a World Series win, and of the four seasons on this list, only Posey’s ended with a ring. But Raleigh’s home run pace puts him on another avenue to legacy.
The All-Star Break ends today, and the 66 remaining games of the regular season start tomorrow. For the Mariners, it will be an opportunity to punch their ticket into the playoffs for the second time this decade. And for Cal Raleigh, it is a marathon that will make or break a push for historic greatness unlike anything we’ve seen from a catcher before.