Analysis: What Exactly Makes Strong Rob Refsnyder Season Quite Likely for Mariners?

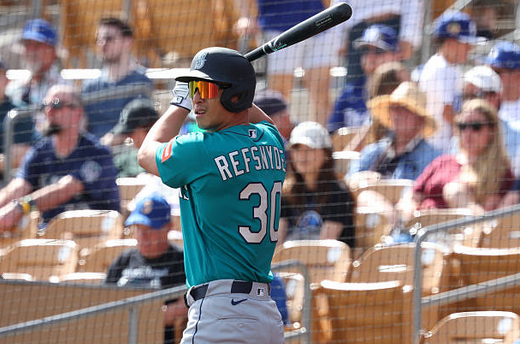
When he went up against a right-handed pitcher between 2022 and 2025, Red Sox outfielder Rob Refsnyder hit .235 with an on-base percentage of .315 and a slugging percentage of .355. Few people in baseball talk about those numbers, because that’s not why the Mariners paid him $6.25 million in December or why the rest of the league is waiting with baited breath to see what the 35-year-old has in store at T-Mobile Park.
Refsnyder’s slash line against lefties in those four years? .312/.407/.516. Against all pitchers, just four players have maintained a .924 OPS or better since 2022: Aaron Judge, Shohei Ohtani, Juan Soto, and Yordan Alvarez. Obviously, Refsnyder isn’t quite in their league (since he’s just doing this against left-handers), but that’s the whole point of a platoon. When it comes to splits versus lefties, Refsnyder’s last four years have been the seventh best among guys with 250 or more plate appearances spread among the past four years.
Diving deeper into the data, we can see even more evidence that Refsnyder sees the ball very well when he has the platoon advantage: he walks 12.8% of the time when a southpaw is on the mound, around the rate that Nick Kurtz drew free passes during the 2025 season. His .407 on-base percentage against left-handers is the third highest since 2022, only less than Judge and Paul Goldschmidt.
[caption id="" align="alignnone" width="505"]
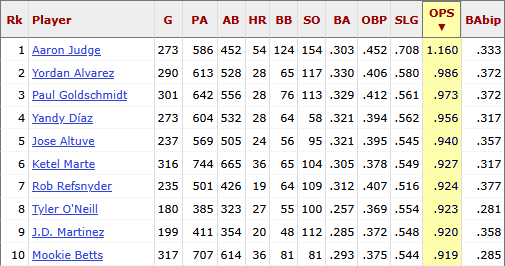
Rob Refsnyder has the seventh-highest OPS vs. LHP since 2022 of anyone with 250 or more PAs vs. LHP. Image sourced from Stathead/Sports-Reference. [/caption]
This lean towards on-base percentage gives the Mariners reason to put him quite high in the lineup. If he keeps up his production in 2026 (more on that later), he should probably be hitting leadoff against lefty starters, a decision that makes even more sense considering that likely leadoff guy Brendan Donovan is a lefty at the plate with better stats against right-handers. When you have a guy potentially hitting like Yordan Alvarez in a situation, you want to make sure he comes up in that situation as much as possible.
There hasn’t been a ton of year-to-year variation in Refsnyder’s platoon performance, but that’s also true for a lot of the guys on this board. He’s typically in the 165-175 range in OPS+, a park and league-adjusted OPS where 100 is league average and higher is better. He did have a down year in 2023, but that is also not unusual.
[caption id="" align="alignnone" width="1545"]
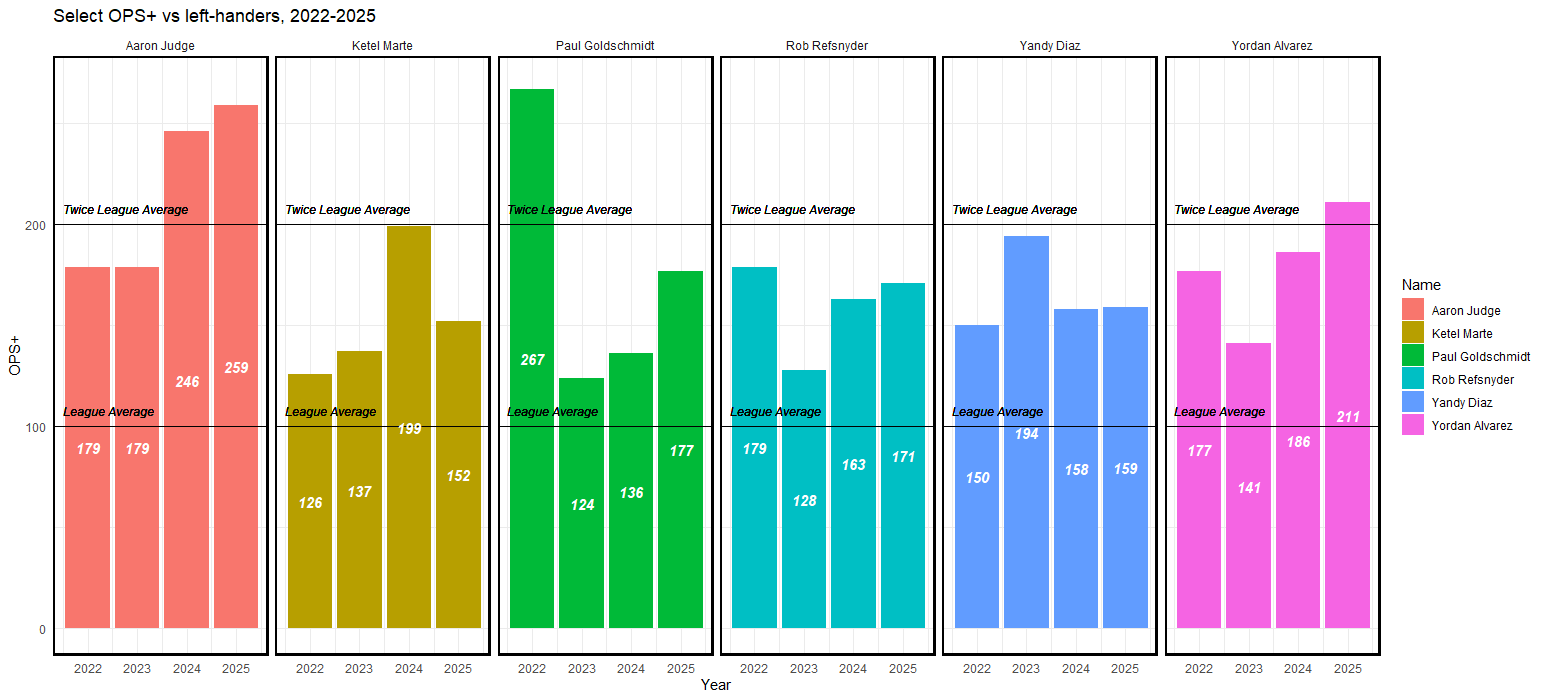
Year-by-year OPS+ vs. LHP for six lefty-mashers since 2022. Data sourced from Baseball-Reference.com and compiled using RStudio. [/caption]
Refsnyder hasn’t had the incredible spike years of Judge or Goldschmidt, but that’s appraisal by faint damnation: both of those guys are future Hall-of-Famers. Much had been made during the offseason about the Mariners being in the running for a big-time Ketel Marte trade, but perhaps the M’s recreated him with Refsnyder and Donovan. Refsnyder, at least, has basically kept up with him against one half of the mound.
But will this production continue into 2026? Unlike many of these top hitters, Refsnyder is getting up there in age, due to turn 35 on March 26. We can expect that a decline in production with age is more likely than not: of a sample of 211 hitters since 1969 who had an .800 OPS or better against lefties between their age 31 and age 34 seasons, 71.6% - over two-thirds - had a lower OPS in their age 35 season than they had over the previous four years. The average OPS decline vs. LHP was .067, which would turn Refsnyder’s .924 into .857, still quite strong as that’s comparable to 2025 Roman Anthony.
[caption id="" align="alignnone" width="1200"]
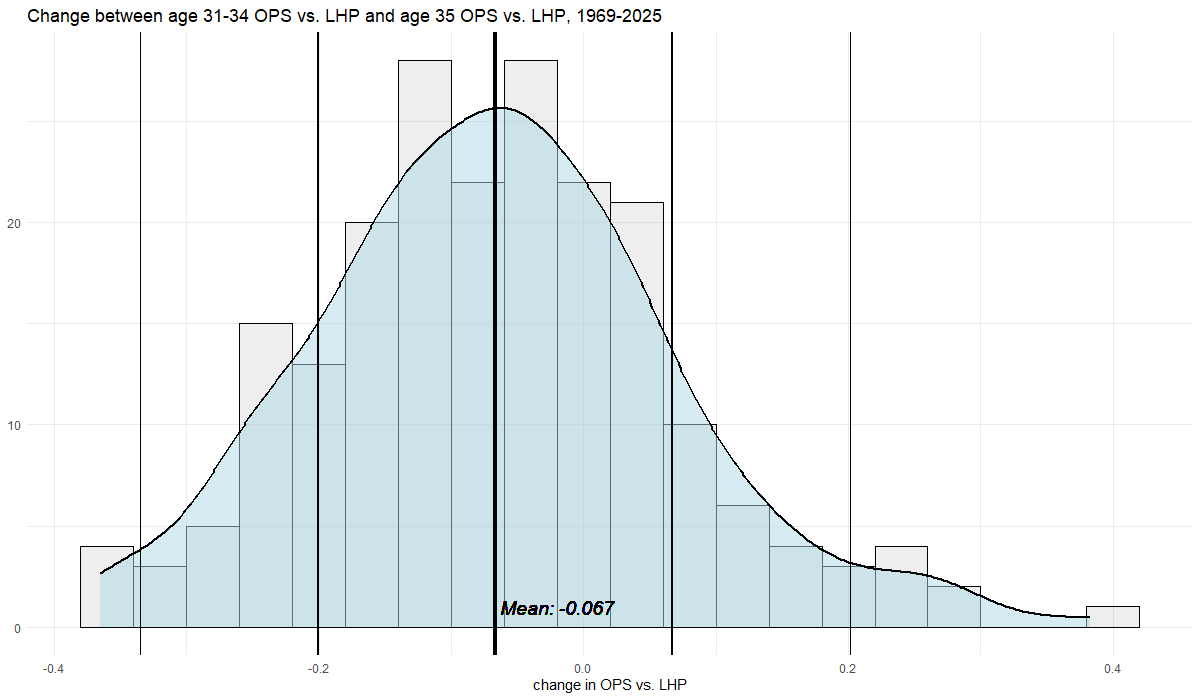
An overlaid histogram and density chart displaying change between combined age 31-34 OPS vs. LHP and age 35 OPS vs. LHP. Data sourced from Stathead/Sports-Reference and compiled using RStudio. [/caption]
We have a pretty textbook standard distribution here, so I’m comfortable making a rough model of Refsnyder’s aging curve for 2026 as follows: play the season over 200 times or so, his OPS will decline an average of .067 points (the sample mean of -.067) with a standard deviation of .134 (taken from the aforementioned data). With this in mind, we can produce a low-resolution curve of those 200 outcomes as such: roughly five results (2.5%) with an OPS .589 or less, roughly 27 results (13.5%) with an OPS between .589 and .723, roughly 68 results (34%) with an OPS between .723 and .857, roughly 68 results (34%) with an OPS between .857 and .991, roughly 27 results (13.5%) with an OPS between .991 and 1.125, and roughly five results (2.5%) with an OPS of 1.125 and above.
Put more simply, the middle half of results (100 of the 200) would be between roughly .775 to .945. I should caveat this with saying that making a model based on a single input obviously leaves a lot else on the table. Steamer estimates Refsnyder’s OPS vs. lefties this year at a much more modest .760 on average, something you will see from most models - they generally work on the assumption that really good seasons such as Refsnyder’s past couple years (they do this with the other end too) are in the outer edges of their “range” and regress accordingly.
Bill Murray is not on the diamond, to my knowledge, so Refsnyder won’t play the season over and over again 200 times: this rough model (given how rough, I might refer to it as a “guide” rather than a model) just gives us an idea of how likely any sort of result might be. When this guide is telling us that he’s got a roughly 85% chance that Refsnyder will have offensive production above league average against lefties, that’s a pretty good sign that he should put up some respectable numbers.
I should probably temper expectations somewhat, if anything out of accordance with the general “assume regression with all else equal” approach (a usually intelligent one) that the public models use. But there is a real reason to suspect Refsnyder has been overperforming over the past four years: his batting average on balls in play [1] (BABIP). It’s a very noisy stat that tends to have little correlation year-to-year and clusters around .290 in the modern MLB. Refsnyder’s against lefties has been .377 since 2022, and that higher figure indicates quite a bit of luck.
I should note that BABIP isn’t entirely random: line drives tend to fall in for hits more often, hard hit balls tend to fall in for hits more often, and so hitters who do one or both of those things tend to maintain higher BABIPs. Aaron Judge, for example, has never had a season with a less than .300 BABIP in years he played 100 games or more. Refsnyder’s not a particularly line drive-heavy hitter, though, so it shouldn’t matter too much.
If you roughly regress Refsnyder’s .377 BABIP to .290 during the past four years (taking his number of balls in play, multiplying it by 0.29, and filling that figure in for non-homer hits), you would get a batting average around .250 and an on-base percentage of .354 against left-handed pitchers: still solid, but not otherworldly. But it doesn’t quite work like that in the real world: his previous results don’t have any predictive value about the future, and while declines in OPS in our earlier aging sample did tend to worsen for hitters with higher BABIPs in previous years, this is mostly BABIP regression and age decline acting independently.
[caption id="" align="alignnone" width="1545"]
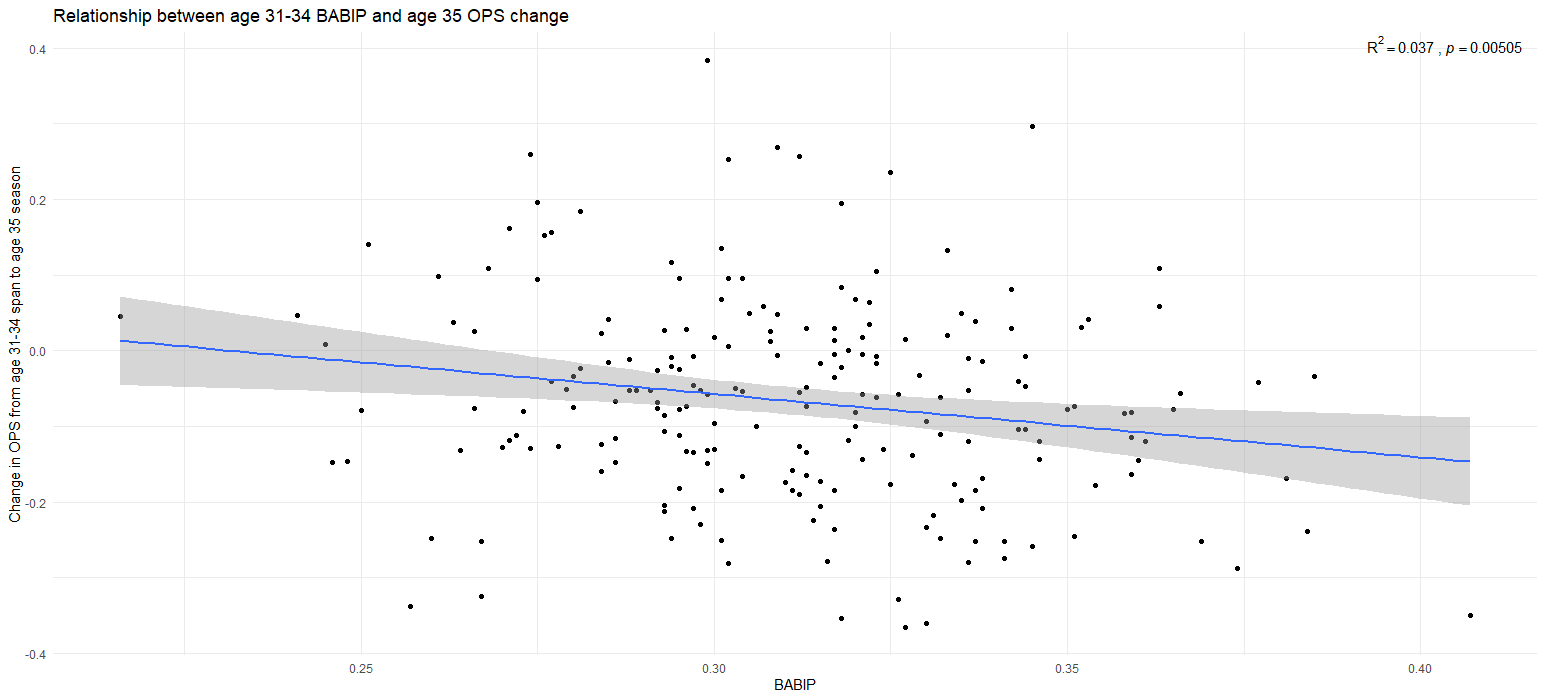
Elevated BABIPs are significantly correlated with age 35 OPS decline from ages 31-34, but the data varies a lot . Data sourced from Stathead/Sports-Reference and compiled using RStudio. [/caption]
While the relation is clear and significant, this luck regression only accounts for 3.7% of the change in OPS. If we apply BABIP to our earlier model and properly weight it to its influence (with all the remaining influence going to our historical curve of OPS changes), our average .857 OPS projection would become … .855.
But I will put more weight on his elevated BABIPs in my own mental model. T-Mobile Park isn’t super kind to batting luck, with its somewhat cozy fences limiting the holes that exist for balls in the air to become hits and the heavy SoDo air dampening home runs. Righties in particular have had notorious issues with the oddly-angled batter’s eye that has a lot of visual changes during clear days.
The increasing popularity of the splitter could also adversely affect Refsnyder, who has a 53.8% whiff rate and just a 79.3 mile per hour average exit velocity against that pitch since 2022. But righties throw more splitters than lefties do - splitters accounted for 1.2% of pitches thrown by left-handers and 4.1% of pitches thrown by right-handers in 2025 - and Refsnyder has done quite well against the main breaking weapons that southpaws are taught.
All this says that Refsnyder is more likely than not to continue his mashing ways against left-handers in 2026. Even if it’s not to a .924 clip (and I would expect it to be lower), he will likely still be striking them well this year, and for a team that has needed a lefty-masher for quite some time, that is a good boon.
[1] Defined as at bats - strikeouts - home runs + sacrifice flies. Its tastier relative BACON (batting average on contact) doesn’t subtract homers.