Interesting Statistics from Mariners’ Dreadful 2-7 East Coast Road Trip

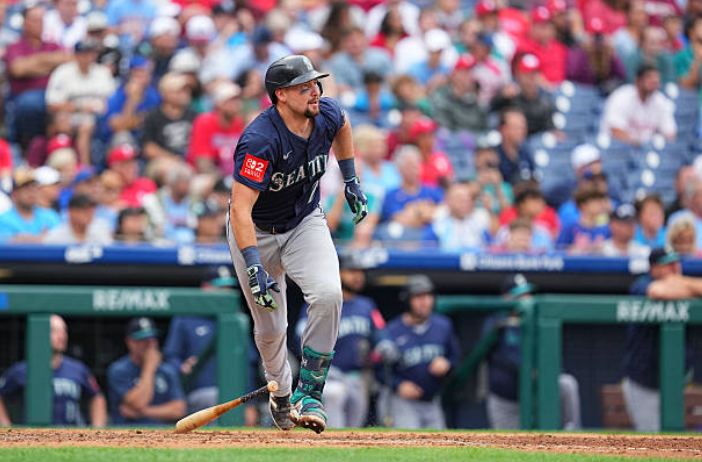
The Seattle Mariners are - thankfully - returning home on Friday. Their last nine games were disastrous, as they dropped two of three to both the Orioles and Mets before getting swept by the Philadelphia Phillies to extend the team’s losing streak to five games. I’ve compiled a bunch of interesting statistics into this article that can help explain what went wrong.
Pitching
Team ERA: 6.75. Let’s start with the basics. This one tells a pretty stark story, especially when you consider the Mariners’ first game of the trip was a shutout and the O’s never put up any really crooked numbers during the first series of the trip. Exclude the Baltimore numbers and you get a horrendous 8.82 ERA over the final six games of the road trip. But obviously, we run into the question: why?
Combined Slash Line Against: .324/.374/.543. This tells us a little more. It was hit after hit after hit, and a lot of those hits were for extra bases. The Mariners pitchers’ control issues for the most part weren’t with leaving stuff off the plate (they didn’t give up a whole lot of walks) but with letting pitches catch way too much of it.
Home Run Rate: 4.3 percent, Strikeout Rate: 19.5 percent, Walk Rate: 6.8 percent. The walk rate is about season average for the Mariners; again, walks weren’t the issue on the road trip. The strikeout rate was down significantly from the M’s season average of 22.3 percent, however, and the home run rate was an increase from the 3.2 percent we’ve seen from Seattle pitchers on the whole in 2025. If we exclude the Orioles series from the numbers, these percentages get even worse: a 5.7 percent home run rate and an 18.6 percent strikeout rate. The walk rate actually improved slightly after the O’s series, going down to 6.9 percent against the Mets and Phillies, again reinforcing that walks were definitely not the issue.
BABIP Against: .367. BABIP, standing for Batting Average on Balls in Play (batting average, not counting strikeouts or home runs) gives you a sense of “luck.” BABIP averages roughly .290 in today’s game and is something that pretty much always regresses to the mean, though the average value is affected by things such as launch angle and especially exit velocity (as higher exit velocities give fielders less time to make a play). This season, for example, overall BABIP is .291 but BABIP on “hard hits”—balls exiting the bat at 95 miles an hour or more—is .413.
Hard Hit Rate: 49.2 percent. This is higher than the 2025 league average of 41 percent. Again, the number gets worse when we consider just the games against the Mets and Phillies, as it goes up to 51.7 percent. But the real ugly numbers come in when we look at the starting pitching.
Starter Hard Hit Rate: 60.7 percent. This is a big reason why Seattle’s starters kept being lit up. Over the whole 2025 season, M’s starters have a 44.2 percent hard hit rate—higher than the league average, but still respectable. Getting the ball hit over 95 miles an hour three fifths of the time, however, is not what you want. And just like with all the other pitching stats, the numbers got worse the longer the road trip went. Against the Mets and Phillies, the hard hit rate against the starters was 67 percent. When two thirds of all batted balls are going 95 miles an hour or more, your defense is simply not going to be able to come up with those plays early in games and you’ll fall behind.
Batting
Runs/Game: 3.89. The Mariners’ average runs scored over the entire season is 4.55, so scoring less than four per game is obviously not ideal. Outside of Seattle’s 11-run performance in the first game of the Mets series, they scored an average of three runs per game. While it was mainly the pitching that fell apart over the nine-game road trip, the batting was also below team average—so what was going on there?
Combined Slash Line: .230/.290/.394. Having an OPS of .684 is, once again, not ideal—especially when the team just added the two biggest deadline bats to their roster. But situationally, it was even worse.
RISP Slash Line: .215/.288/.354. Issues with runners in scoring position continued in force during the road trip. The Mariners’ overall OPS with RISP during 2025 is .695, 23rd in MLB. Over the second half, that figure drops to .589, with the batting average being .185. These are not good numbers to have when you have an opportunity to drive in runs.
Home Run Rate: 2.7 percent, Strikeout Rate: 27.8 percent, Walk Rate: 6.6 percent. Compared to season numbers of a 3.7 percent home run rate, 23.6 percent strikeout rate, and an 8.4 percent walk rate, each of these three numbers took a decline during the recent road trip. Situationally, these numbers changed, but bidirectionally.
RISP Home Run Rate: 1.4 percent, RISP Strikeout Rate: 24.7 percent, RISP Walk Rate: 9.6 percent. Here we see that the home run rate with RISP fell off a cliff (just one time out of 73 opportunities) while the strikeout and walk rates actually improved with RISP compared to without.
BABIP: .301. This shows that despite the lowered outputs, it wasn’t any matter of overall bad luck per se. Rather, the Mariners even got slightly lucky as to which batted balls became hits. But again, when you filter by runners in scoring position, it does again become a little worse, going down to .277. Believe it or not, that is actually higher than the Mariners’ 2025 season BABIP with RISP, which is .262 (compared to an overall .288 BABIP). This runs counter to the general league trend, where BABIP is barely affected by runners in scoring position. Perhaps this is, in essence, an element of randomness—the M’s BABIP with RISP in 2024 (with a much worse overall offense) was .294—but it shows how the Mariners keep on struggling with runners on.